An MACD is a technical analysis tool used by various traders. The use of technical analysis in a trade is an essential part of trading. Technical analysis is needed to pinpoint the entry and exit of a trade. Trading without technical analysis is synonymous with gambling. That is like entering trade blindly, without any plan and strategy. Entering a trade blindly will lead to loss of funds and unsuccessful trades. Trades who trade without technical analysis are gamblers who believe in luck and intuition. To become a successful trader and have a successful career in trading various assets, you must incorporate the use of technical analysis in your trades. Also using technical analysis is one of the many factors that influence successful trades, other things must be put in place to achieve successful trades. There are different types of technical tools, and in this article, we will focus on what is and how to use MACD indicators.
Table of Contents
WHAT IS AN MACD INDICATOR?
MACD is the short form of Moving average convergence divergence. This is a top technical analysis indicator used by traders to ascertain the movement of a financial asset. This technical indicator was developed by Gerald Appel in the late 1970s. The indicator was constructed to indicate the fluctuations in the strength, momentum, direction, and p3riod of a trend in the price of a financial asset. The indicator reveals the correlation between two moving averages of the price of a trade.
HOW TO USE MACD INDICATOR
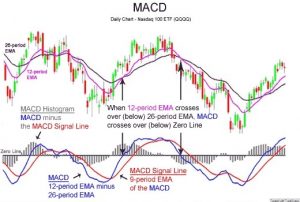
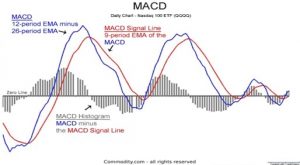
The MACD is estimated by deducting the 26-period exponential moving average (EMA) from the 12-period EMA.
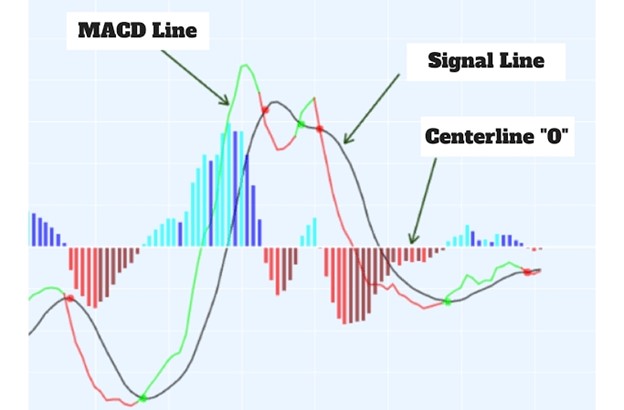
The MACD line is the estimated result. The signal line, referred to as the 9-day EMA, is constructed above the MACD line; this plotted line serves as an indicator for buy and sells signals. When the MACD line moves above the signal line, it is noted as a buy signal, and when the MACD line lives below the signal line, it indicates a sell signal. Traders illustrate the MACD moving average convergence divergence in different ways, the most common are quick price fluctuations, divergences, and crossovers.
MACD is mainly illustrated in the form of a histogram, this shows the distance between the MACD and the signal line. When the MACD crosses over the signal line, the histogram also crosses the MACD’s baseline. Also, the histogram will be below the MACD’s baseline, when the MACD crosses under the signal line. Traders utilize this technical indicator to pinpoint uptrend or downtime momentum is high.

For example, an MACD chart showing three numbers being used in its settings.
- The first number represents the number of periods being utilized in estimating the fast-moving average.
- The next amount of periods is used in the estimation of the slow-moving average.
- And the last is the number of periods used in the estimations, the moving average of the disparity between the first MA and the second MA.
For instance,
Trade settings of 12, 26, and 9 MACD parameters, will be interpreted as thus:
The 12 period is the moving average of the prior 12 periods.
The 26 periods is the moving average of the earlier 26 periods.
The 9 periods depict a moving average of the disparity between the above-mentioned moving averages.
NOTE: These parameters used are the default settings of any MACD chart. However, these charts can be changed and personalized to suit the trader’s trading strategy.
THE MACD LINES
Traders often mistake the MACD lines to be the moving average of the price. This is a fallacy.
The MACD is made up of two lines namely:
The MACD line
The Signal line.
These two lines are drawn, they are not moving averages of the price. But rather the MACD line is the disparity or distance between two MA’s. They are known as the Exponential Moving averages (EMA’s)
When analyzing an indicator, the MACD line shows the fast-moving average.

For instance, in a chart showing the MACD line as the distance between the 26-period and the 12-period MAs.
The Signal line represents the MAC line moving average.
When analyzing a chart, the slow-moving average is the Signal line.
The default setting of most charts is the 9-period exponential moving average (EMA).
This implies that the trader will use the average of the last 9 periods of the faster MACD line and construct it as the slower moving average.
The main objective of the Signal Line is to blur out the noise of the MACD Line, making the readings more accurate.
THE HISTOGRAM OF THE MACD INDICATOR

The Histogram illustrates the distance between the Signal line and the Moving average convergence divergence line. The histogram is also a structural indication of the difference between the two lines. Sometimes, it acts as an indicator of a potential crossover.
DIVERGENCE AND CONVERGENCE ARE EXPLAINED.
When the two moving averages the Signal line and the MACD line diverge, the histogram increases.
If the MACD line separates further from the Signal line, this process is referred to as a MACD divergence, because it entails the diverging of the two MAs.
Additionally, when the two moving averages contract, the histogram reduces. This process is known as convergence because the MACD line (fast-moving MA) is contracting (converging) with the Signal line (slow moving average). This process is known as MACD convergence.
This explains the origination of the technical indicators name Moving Average Convergence Divergence.
CONCLUSION
The use of technical indicators in trades is for traders to make good trade analyses. It enables traders to know the way the market will go and plan their trading strategy accordingly. However, the use of MACD in isolation is not advised. Traders are advised to use the indicator combined with other technical tools such as the relative strength index and a host of others.


