Table of Contents
What is and how to use RSI
A Lot of traders find it difficult to navigate the technical aspect of a trade. Technical analysis is important in analyzing trades and determining the best time to enter and exit a trade. There are numerous technical indicators used by traders and one of them is the RSI Relative strength index indicator. It is used by most traders in conjunction with other technical tools to ascertain the best time to exit and open a trade.
WHAT IS RSI INDICATOR?

A Relative Strength Index (RSI) is a technical indicator mostly used by traders to pinpoint possible entry and exit points. This indicator is a momentum indicator used in estimating the overbought and oversold situations in the value of a financial asset. The RSI is shown as an oscillator which is a line graph that slides between two ends and reads from 0 to 100. The RSI indicator was originated by J. Wells Wilder Jr. He introduced the RSI indicator in his seminal book in 1978 titled New Concepts in Technical Trading Systems.
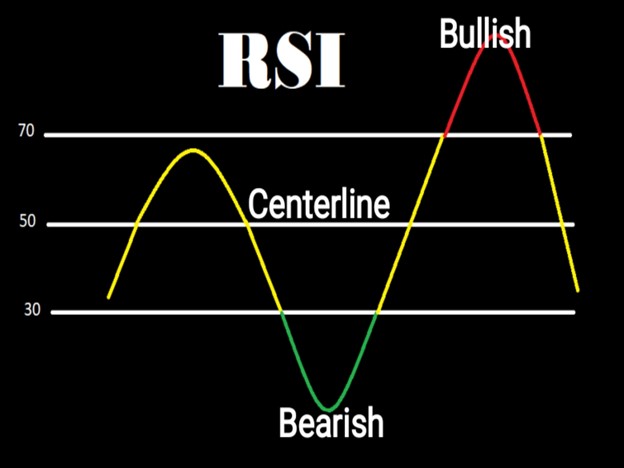
When the RSI indicator reads 70 and above, it shows an overbought or overestimate trade. And it indicates a possible price reversal or a price consolidation. When an RSI shows a reading of 30 or below, it means that the trade is oversold, and a possible price reversal can occur.
HOW TO USE THE RSI INDICATOR

The main trend of the financial asset is a significant tool in ensuring that the readings of the indicators are appropriately understood. It’s been stated that an oversold RSI reading showing an uptrend is probably way higher than 30% and an RSI reading showing an overbought trade is way lower than the 70% level.
During a downtrend, the RSI moves close to the 50% level instead of the 70% level, this is used by traders to note a more significant bearish signal. Most traders employ the use of horizontal trend lines between 30% and 70% levels when they note a signal with high momentum. It is unnecessary to amend the oversold and overbought levels when the price of a trade is set to a long-term horizontal channel.
The best way to use the oversold or overbought signals is to use them focusing on the trade signals and methods used in confirming the trend. That means a trader is to use the bullish signals when the trade is bullish, and use the bearish signals when the trade is in a downtrend. This will help minimize every false reading that will be generated by the RSI.
When the RSI exceeds the horizontal 30 reading, it depicts a bullish trend, and when it moves below the horizontal 70 reading, it shows a bearish trend. To explain further, the RSI value of 70 or above means the trade is becoming overbought or expensive and could begin a price reversal or the price of the trade could consolidate. An RSI indicator showing a 30% readings level or below signals an oversold trade. And it shows that traders are in control of the market.
When a trade is trending, the RSI readings fall between 30 and 70. In a bearish trend, the RSI reading hits between the 30% level or below, it is rare for the RSI reading to move above 70 during a downtrend. During an uptrend, the RSI reading moves above 30 and sometimes hits 70 and above. These indicator guidelines help trees to pinpoint the movement of price and also determine the trend of trades and ask know when the price is about to consolidate.
For instance, if during a bullish trend and the RSI readings fail to hit the 70 lines, but rather slide below the 30 lines, this only indicates a potential price reversal to the bearish side of the trade.
This also applies to a bearish trade, when a trade is in a bearish trend and fails to hit the 30 lines but rather moves above the 70 lines it only shows a price reversal to the bullish side of the trade. However, when using the RSI indicator it is advisable to also employ the use of Moving averages because they are very helpful indicator tools and will help give more accurate readings.
PROS AND CONS OF RSI INDICATOR
PROS OF RSI INDICATOR
- Executing and using RSI is easy
- The RSI indicator helps traders in determining price reversals.
- The indicator is used by traders to disclose the loss of momentum.
CONS OF RSI INDICATOR
- RSI indicator gives false signals in a trending zone.
LIMITATIONS OF RSI INDICATOR

The RSI indicator just like every other indicator has its limitations.
For instance, the RSI indicator correlates the upward and downward trends and illustrates the readings in an oscillator that can be fixed under a price chart. Just like every other technical indicator, the readings of this oscillator are more accurate during a long-term trend.
Generating accurate price reversal signals is difficult. This is because it is almost impossible to separate the false signals from the true signals. For instance, a false bullish signal is when the price breaks through resistance, and still falls back after a brief period. While a false bearish trend will be when the price declines and still shoots back up after a brief period.
The RSI indicator is more active when a trade is trending. This is because the indicator shows the momentum of trade, and therefore sometimes it can remain overbought or oversold even when the trade is moving in another trend direction.
CONCLUSION
Just like every other technical indicator, it is not advisable to use RSI in isolation. The indicator should be used in conjunction with other technical indicators such as the Moving averages or the Moving average convergence divergence.
This is because the use of more than technical indicators provides a more accurate trading signal. And also during proof reversals, traders are advised to not trade the price breakouts immediately, but rather, wait for the price to break on the other side of the trend before opening a position. This precaution is taken to avoid trading false breakouts.


